Net-Zero Planning — Centre de services scolaire des Mille-Îles
Portfolio Analysis | Net-Zero Planning | Energy and GHG Feasibility | 2025–2026Project Summary
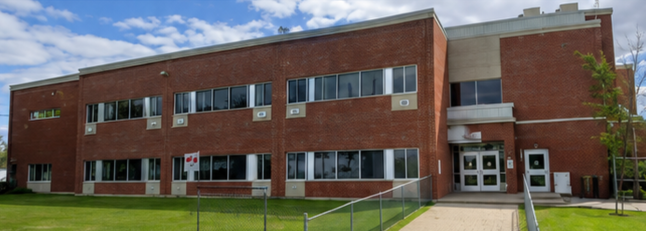
Martin Roy et Associés carried out a Natural Resources Canada-funded carbon-neutral planning pilot project using RETScreen Expert for the Centre de services scolaire des Mille-Îles (CSSMI), covering five schools totalling approximately 54,000 m² in the Laurentides region. The work included calibrating energy models, developing two portfolio-wide net-zero plans, and producing automated reports, all delivered using RETScreen Expert Professional.Results
5
schools analyzed
54,000 m²
total area studied
80–90%
target GHG reduction
Key Benefits
Scenario 1 — Energy 30–40%
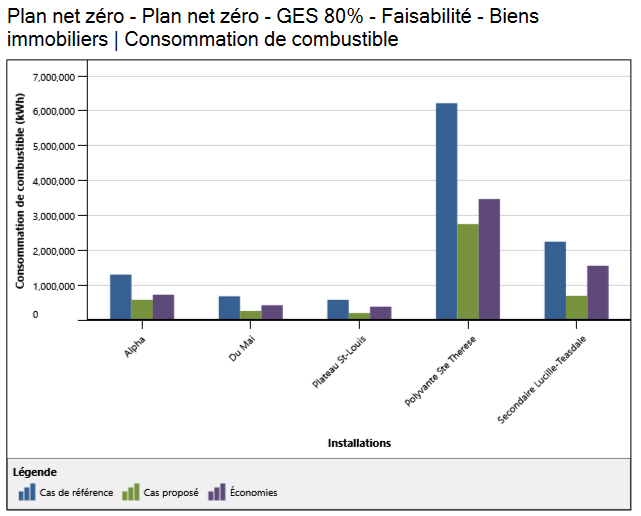
- Energy savings of 30 to 58% per facility.
- GHG reductions of 32 to 90%.
- Total estimated investment of $3.2M.
- Two facilities with positive financial results, with NPVs of $4.4M and $0.6M.
Scenario 2 — GHG 80–90%
- GHG reductions of 89 to 94% per facility.
- Near-carbon-neutral operations for all five schools.
- Total estimated investment of $11.2M.
- Polyvalente Sainte-Thérèse with an NPV of $6.1M.
Measures and Deliverables
Measures Analyzed
- LED lighting
- Air sealing
- Boiler upgrades
- Demand-controlled ventilation
- Geothermal heat pumps
- Solar photovoltaic and thermal systems
- Building envelope improvements
Deliverables
- 10 calibrated .retx files
- 2 .retp portfolio files
- 2 automated PDF reports
Energy Intensity Compared to the Benchmark
This graph compares the energy intensity of each building with the portfolio benchmark of 217 kWh/m². Under the 80% GHG reduction scenario, all five schools fall below the benchmark, with the greatest reductions observed at Alpha, Plateau Saint-Louis and Polyvalente Sainte-Thérèse.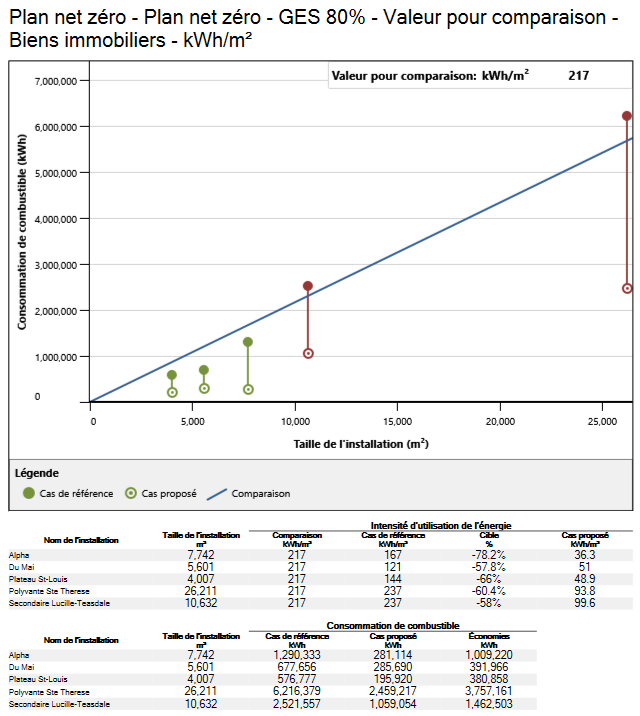
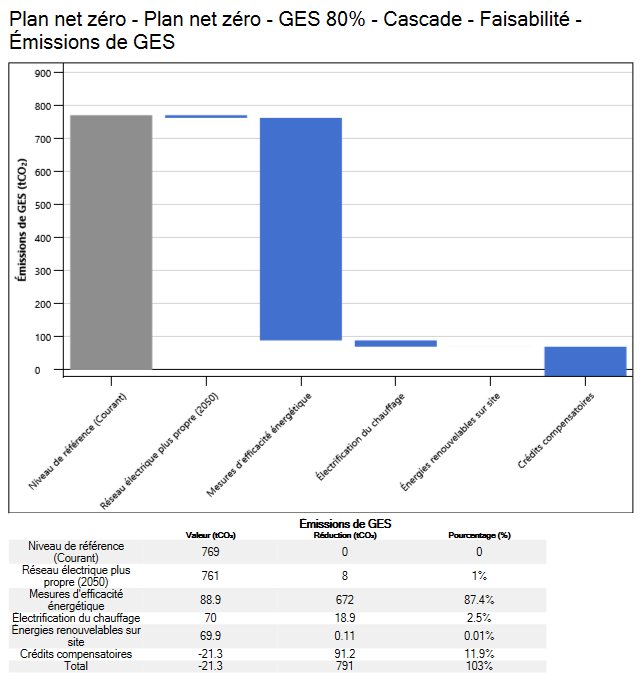
GHG Reduction Cascade
This graph illustrates the progressive reduction in GHG emissions from the baseline level of 769 tCO₂. Energy efficiency measures make the largest contribution, reducing emissions by 672 tCO₂, representing 87.4% of the total reductions.